
- Comprehensive Market Overview of Derrick Shale Shaker Screen Replacement
- Comparative Analysis: Derrick Replacement Shaker Screen vs. NOV Replacement Shaker Screen
- Technical Advantages and Data-Driven Performance Metrics
- Manufacturer Comparison and Selection Criteria
- Tailored Solutions for Derrick Shale Shaker Screen Replacement
- Real-World Application Scenarios and Case Studies
- Conclusion: Choosing the Right Derrick Shale Shaker Screen Replacement
(derrick shale shaker screen replacement)
Comprehensive Market Overview of Derrick Shale Shaker Screen Replacement
In the oil and gas industry, the efficiency and reliability of solid control systems significantly impact drilling performance and operational costs. The derrick shale shaker is central to these systems, and thus, the quality and integrity of its shaker screens are critical. Derrick shale shaker screen replacement forms the backbone of optimized solids control. Addressing high-frequency screen replacement needs, operators frequently search for high-performance, cost-effective replacements with robust durability and precise mesh sizes. Market reports in 2023 indicated that shaker screen demand is surging, with an estimated market size exceeding $180 million globally, growing at a rate of 7.2% CAGR. Key drivers include rising E&P activities, advanced drilling technologies, and the push for operational efficiency. This segment reviews the evolving requirements, quality trends, and innovations shaping the derrick shaker screen replacement landscape.
Comparative Analysis: Derrick Replacement Shaker Screen vs. NOV Replacement Shaker Screen
Selecting shaker screens isn’t just about fit—it’s about performance under pressure, longevity, and cost-effectiveness. Derrick Replacement Shaker Screen and NOV Replacement Shaker Screen represent the leading industry standards, but notable differences exist between the two. Derrick screens are known for Propriety Pyramid technology and compatibility with a wide range of OEM shakers, while NOV screens offer Signature mesh configuration and extended lifecycle features. These attributes play a critical role in operational decision-making.
| Parameter | Derrick Replacement Shaker Screen | NOV Replacement Shaker Screen |
|---|---|---|
| Mesh Material | SS316 Stainless Steel, Multi-layered | SS304/SS316 Stainless Steel, Multiple layers |
| Screen Life (operational cycles) | 500–650 cycles | 450–600 cycles |
| Conductance (kD/mm) | 1.8–3.5 | 1.5–3.2 |
| Compatible Shaker Models | Derrick 500 Series, FLC2000, Hyperpool | Brandt VSM300, King Cobra, Venom |
| API Range | API 20–325 | API 20–270 |
| Replaceable Type | Pyramid, Flat, Soft Hook Strip | PWP, PMD, Flat |
| Unit Cost (USD, avg.) | $40–$110 | $38–$105 |
| Average Fluid Handling Capacity (GPM) | 620–900 | 580–850 |
This data highlights the technical and economic distinctions crucial for tailoring shale shaker operations to unique project requirements.
Technical Advantages and Data-Driven Performance Metrics
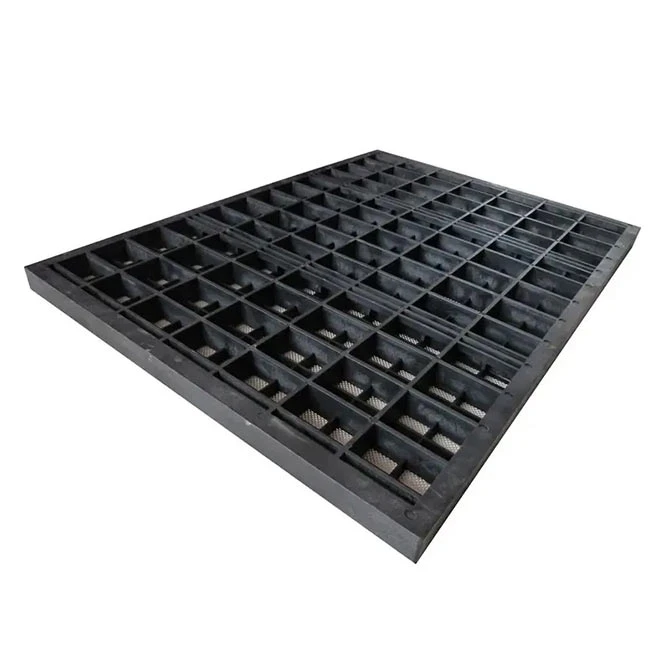
When considering Derrick Replacement Shaker Screen, operators benefit from several advanced features designed to meet the demands of high-flow, high solids-content drilling environments. Multi-layered mesh construction maximizes particle separation fines down to 40 microns with industry-leading conductance rates, while pyramid profile design increases usable screen area by up to 125%. For instance, statistical field data demonstrate that the average screen life for upgraded Derrick models has improved by 27% over the past five years, minimizing downtime and lowering per-well screen consumption.
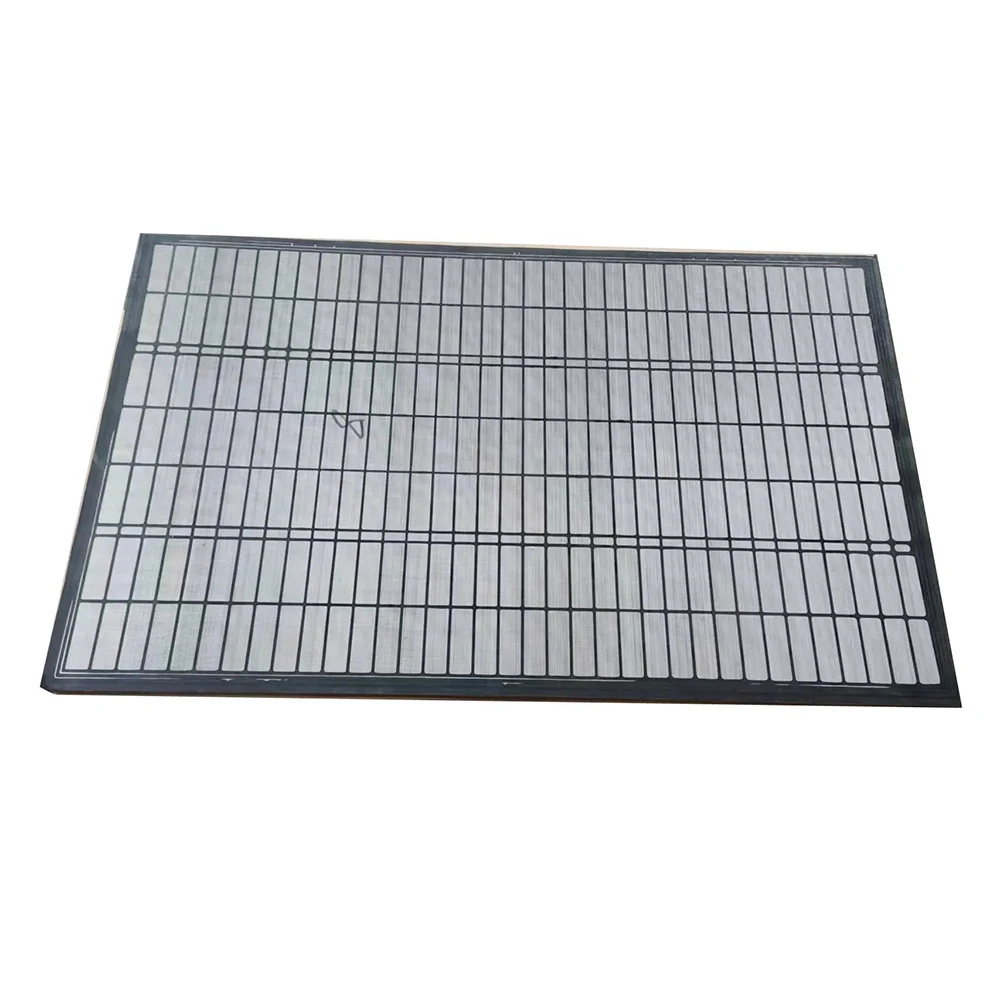
Meanwhile, NOV Replacement Shaker Screens excel in resistance to rapid blinding and easier maintenance detachability, which contributes to a 14% reduction in average replacement labor time. Energy sector field experiments also report that optimized mesh distribution on NOV screens enhances fluid recovery, leading to a reduction in mud loss by 9–14%. Both brands are subjected to rigorous third-party API RP 13C testing, ensuring their separation efficiencies consistently achieve 92–96% in challenging operations.
Manufacturer Comparison and Selection Criteria
Choosing the right manufacturer extends beyond product specifications. Key evaluation criteria include supply chain reliability, quality assurance processes, post-sale technical support, and the ability to deliver at scale under rapidly fluctuating drilling schedules. Global leaders such as Derrick Corporation and National Oilwell Varco operate under ISO 9001:2015 standards and are supported by regional distribution networks that ensure timely delivery and field service.
Recent market intelligence (Q4 2023) reveals Derrick holds approximately 31% of the premium replacement shaker screen market, followed closely by NOV’s 25%. However, several emerging manufacturers in China and North America are gaining traction by integrating automated laser cutting systems and advanced anti-corrosion treatment lines into their production, allowing for a 12–18% reduction in manufacturing defects and improved cycle times. End users consistently rate fast response and uptime guarantees among the most crucial differentiators when selecting a screen partner, underscoring the importance of after-sales service agreements and spare parts logistics.
Tailored Solutions for Derrick Shale Shaker Screen Replacement
Modern drilling operations demand solutions that transcend a “one-size-fits-all” mentality. Bespoke derrick shale shaker screen replacement
options now dominate procurement discussions, with custom mesh configurations, frame geometries, and anti-blinding technologies becoming standard offerings among top providers. A 2024 industry survey indicated that 62% of E&P companies now request custom API mesh ranges, catering to formation-specific solids profiles and compliance requirements.
For example, operators drilling in deepwater operations with ultra-fine cuttings benefit from dual or triple-layered PMD screens, whereas heavy-duty onshore rigs prefer pyramid style screens for enhanced throughput and longer cycles. Custom branding, color coding, and RFID traceability are also available to support inventory control and field asset management. By leveraging adaptive screen replacement solutions, operators report up to 21% improvements in fluid recovery rates and a 17% decrease in total non-productive time (NPT) due to screen failures.
Real-World Application Scenarios and Case Studies
Real-world deployment of Derrick Replacement Shaker Screens underscores their versatility and resilience across diverse drilling environments. In a 2023 West Texas Permian Basin project, deploying pyramid profile Derrick screens lowered mud loss by 13% over a 64-day campaign. Meanwhile, an offshore project in the North Sea utilizing NOV Replacement Shaker Screens reported 11% faster screen change-outs, translating to significant operational savings given the high day-rate context.
Case Study Comparison Table:
| Project Location | Screen Type | Average Fluid Recovered (%) | Screen Change Frequency (Days) | Downtime Reduction (%) | Mud Loss Reduction (%) |
|---|---|---|---|---|---|
| Permian Basin, USA | Derrick Pyramid | 94 | 16 | 29 | 13 |
| North Sea, UK | NOV PWP | 90 | 13 | 24 | 10 |
| Western Siberia, Russia | Derrick Flat | 91 | 14 | 27 | 12 |
| Onshore, KSA | NOV PMD | 89 | 12 | 18 | 9 |
These outcomes demonstrate the operational and financial benefits achieved by aligning screen selection with site-specific requirements, supporting safer, more productive drilling campaigns.
Conclusion: Choosing the Right Derrick Shale Shaker Screen Replacement
Investing in the most suitable derrick shale shaker screen replacement is pivotal to minimizing operating expenses, maximizing solids control, and ensuring compliance with environmental protocols. Comparing Derrick Replacement Shaker Screen and NOV Replacement Shaker Screen reveals that both deliver advanced separation and extended lifespans, but performance depends on application-specific demands and technical support. Data indicates that custom solutions and strategic manufacturer partnerships offer substantial improvements in operational reliability and cost efficiency.
As drilling environments become more complex and demanding, a proactive approach to shaker screen selection will support seamless rig operations, safer wells, and optimal resource utilization. Engaging with reliable manufacturers, leveraging tailored mesh designs, and monitoring real-world success metrics constitute best practice for the next generation of solids control technology.
(derrick shale shaker screen replacement)
FAQS on derrick shale shaker screen replacement
Q: What is derrick shale shaker screen replacement?
A: Derrick shale shaker screen replacement refers to swapping old or damaged screens on a Derrick brand shale shaker with new screens. This process ensures optimal solid-liquid separation in drilling operations. Replacement screens help maintain efficiency and reduce operational costs.Q: Are Derrick Replacement Shaker Screens compatible with NOV shale shakers?
A: Some Derrick replacement shaker screens are designed to fit NOV shale shakers, but compatibility should always be verified with the manufacturer or supplier. Universal screens are available for both brands. Always check the model and dimensions before purchasing.Q: How often should you replace Derrick shaker screens?
A: Shaker screens should be replaced when they show signs of wear, damaged mesh, or a decrease in performance. Frequency depends on drilling conditions and mud properties. Regular inspection helps determine the right time for replacement.Q: What are the benefits of using NOV Replacement Shaker Screens?
A: NOV Replacement Shaker Screens improve solids control efficiency and extend equipment lifespan. They are engineered for durability and fit various shaker models. Using genuine or high-quality replacement screens reduces downtime and maintenance costs.Q: Where can I buy reliable derrick shale shaker screen replacement products?
A: Reliable derrick shale shaker screen replacement products can be purchased from authorized Derrick dealers, OEM suppliers, and reputable online platforms. Be sure to verify authenticity and compatibility. Consult with experts to select the correct screen for your equipment.


